Prometheus 2.27.0 is released. This release provides enhancements across the board.
Let’s dig into some of the major improvements of the release. The list is not complete, please see the fc for more.
Exemplars remote write
Exemplars support is something that will grow in the coming months.
Introduced in Prometheus 2.26, exemplars enable you to attach external data to metrics. The practical use case is to attach trace ID’s that contributed to a specific metric:
foo_bucket{le="120"} 5 # {trace_id="4bf92f3"} 119.8 1620807175.781
This metric specifies that the transaction traced as 4bf92f3 contributed to
this bucket. The request took 119.8 seconds. Based on this, and appropriate
tooling, operators can quickly jump to a relevant trace to react to incidents.
The exemplars query API, and in-memory storage for the exemplars were already available in Prometheus itself, and this new release adds remote write to exemplars, opening new possibilities for remote write storage solutions.
Dark mode
The Prometheus UI keeps getting improvements. A major improvement was introduced already in the last release: an enhanced query editor was introduced.
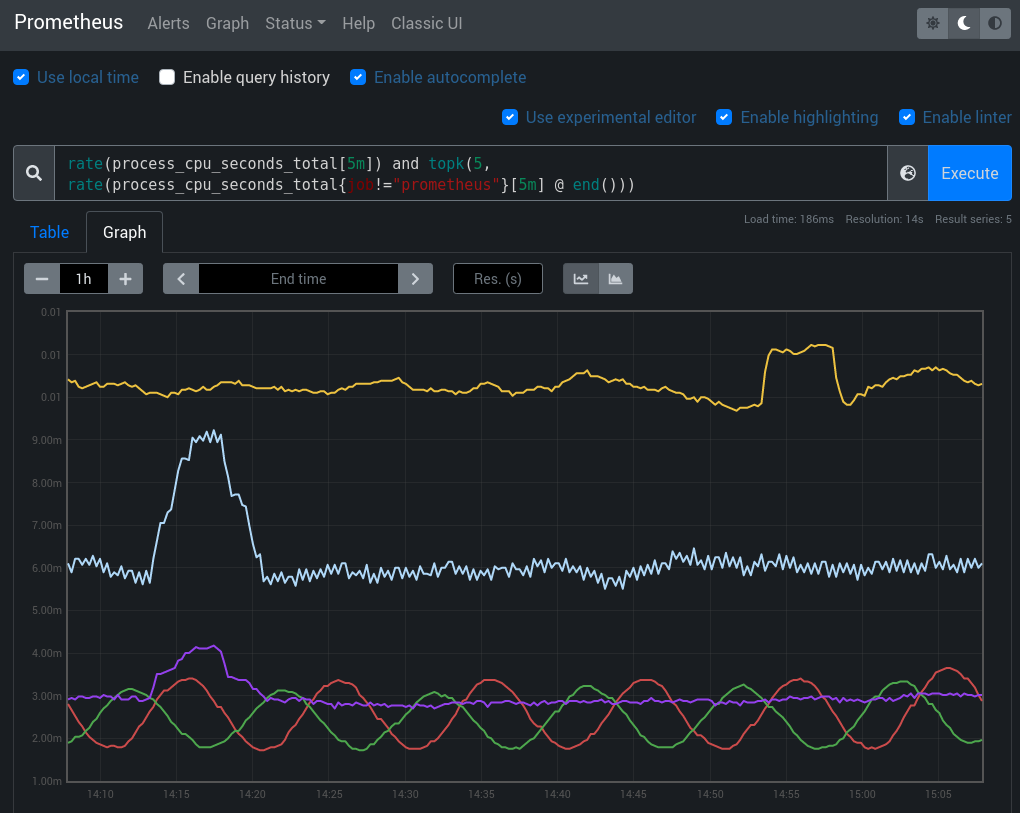
This cycle introduces another big feature: “dark mode”. There is a switch in the UI that enables you to toggle between light mode and dark mode.

It already looks great, and it will be further improved in upcoming Prometheus releases.
Support for smaller devices
In the last developer summit, we highlighted the fact that Prometheus should be usable also in smaller devices. Prometheus already works on such devices. A lot of users have Prometheus running on Raspberry Pies devices, and we want to continue to support homelab usecases, IOT usecases, alongside the bigger traditional setups.
A first step is taken in this release, with the introduction of a flag
--storage.tsdb.max-block-chunk-segment-size to reduce the on-disk size
required by Prometheus. By default, Prometheus pre-allocates 512MB files.
This flag can trim this preallocation down to 1MB.
New service discoveries
Service discovery is at the heart of Prometheus. In this release, we have two new service discoveries. They are actually siblings of existing service discoveries: next to the existing EC2 service discovery, we have added lightsail service discovery. And there is brand new Docker service discovery now sitting next to the Docker Swarm service discovery.
The AWD Lightsail SD used to live out of the tree - I have reached to the developers to bring the integration within Prometheus directly, and worked with them to bring this in Prometheus proper.
The docker service discovery was also a frequent users request. This should help
deploying Prometheus on smaller setups, while using the great service discovery
mechanism we have. This service discovery is partly based on the code used for
the Docker Swarm discovery, so it does not match the existing external file_sd
integrations.
OAuth 2.0 support
Prometheus support many authentication mechanisms - TLS, Basic authentication. We also support SIGv4 for remote write, since the last release.
This release adds another HTTP authentication mechanism: OAuth2.0 / OpenID Connect. This is client-side authentication, so Prometheus can fetch access tokens using the OAuth 2.0 Client Credentials Grant and use them to talk to the targets.
This feature is mainly targeted at remote write but also works in scrapes. In general it is best that Prometheus scrapes targets directly (e.g without a proxy). OAuth2.0 adds a dependency to a 3rd party service (the OAuth2.0 provider), so this is not recommended for monitoring critical services.
Retroactive rules evaluation
This release adds a new way to “backfill” data into a Prometheus server:
promtool tsdb create-blocks-from rules --start=1606382352 --end=1606389552 \
    --output-dir tmp-data  --url http://127.0.0.1:9090 rules.yml
You can now backfill rule evaluation inside a Prometheus server. This is useful to see what your rules would have provided as results in the past. You can read Jessica’s blog post to learn more about it.
Conclusion
This Prometheus release is packed with plenty of exiting features - not all of them are described here. You can read the full changelog to read about all the other bugfixes and enhancements.
There is still a lot of exciting things to come in the next releases, as we continue to work with the community to improve Prometheus and the ecosystem.

